Visualize your MYSQL data with Flowtrail AI

In the busy field of data analytics, quickly getting useful information from big datasets is very important. But for many, pulling out, studying, and showing this data can be tough. It often needs special skills and hard-to-use tools. Here comes Flowtrail – a new AI data analytics tool. It’s built to change how you work with your MySQL data.
What’s Flowtrail AI
Flowtrail is based on a simple but powerful idea: to make it easy for users to turn their databases into insightful visuals. With Flowtrail, users can easily link their MySQL databases and use the platform’s easy-to-use interface to create custom datasets and show them with ease. Whether you’re an experienced data analyst or a new user, Flowtrail has many ways to explore and find the valuable data within your database. The platform’s strong features allow users to build various visualizations, from simple charts to detailed graphs, either using a simple AI chat interface or using custom dataset builder directly connecting to your database. Say goodby to traditional barriers, with Flowtrail, anyone can become good at visualizing data.

Benefits of Flowtrail AI
Flowtrail AI offers numerous advantages to your business, allowing you to utilize your data in unprecedented ways:
Simplicity: With its intuitive interface and powerful AI-driven capabilities, Flowtrail AI simplifies the process of data analysis, making it accessible to users of all skill levels.
Speed: Flowtrail AI’s advanced algorithms enable quick data processing, helping you gain insights faster and more efficiently.
Scalability: Whether you are a small business or a large enterprise, Flowtrail AI scales according to your needs, ensuring you can handle any volume of data.
Insightful: With its AI-driven analytics, Flowtrail AI enables you to uncover deep insights from your data, helping you make strategic business decisions.
Security: Flowtrail AI prioritizes data security, safeguarding your valuable business data at all times. Its workspace-based default permission system allows users to manage their data privacy. Users can also configure what the AI model should examine to generate the visualizations.
Collaborative: Flowtrail AI promotes collaboration across teams by providing a unified platform for data analysis and sharing.
Cost-Effective: By automating manual data processing and analysis, Flowtrail AI can save your business valuable time and resources, making it a cost-effective solution for your data needs.
How to visualize your data with Flowtrail
At this point, you should have a good understanding of Flowtrail. Now, let’s explore how to create your first data visualization. The process of creating a report can be divided into three simple steps.
- Establish a connection to your database
- Build dataset for your report
- Configure your report
In addition to these steps, we will be delving deeper into the process of publishing the report. We aim to ensure that the report is not only published, but also accessible through a public URL. This way, anyone who needs to view the report can do so easily and conveniently, regardless of their location or the device they are using.

Configure connection
Flowtrail is a flexible platform that works with many databases to help you build large datasets. In this case, we’re going to use MySQL. To begin, you first need to establish a connection with your database. Here’s how you do it:
Log in to your account on Flowtrail. Once you’re logged in, look for the data source section. This is where you’ll set up the connection to your database.
Click on ‘Add New Connection’ or a similar option to add your first database connection.
Select ‘MySQL’ from the data source type options at the top of the form.
Next, fill in your database credentials. This typically includes your database’s hostname or IP address, username, password, and the database name.
Once you’ve filled in the necessary details, all you have to do is click ‘Save’.
And that’s it! In just a few simple steps, you’ve established a connection between Flowtrail and your MySQL database. Now you’re ready to start visualizing your data in new and insightful ways.

Interact with database connections
After creating the data source connection, you can explore it and view its tables on the connection explorer page. To view the data for each table, double-click the table name in the left sidebar tree node.
Click on the “Explore” icon in the connection list row to open the explorer page.

Build dataset
After storing the connection details, the next step is to create the dataset query for your report. If you have SQL knowledge, you can write the query directly in our dataset editor. To save your first dataset, follow these steps.
- Navigate to the dataset option from sidebar menu
- Select the desired DataSource from the list. The SQL query will be executed and saved against that connection.
- Now, it’s time to write your query. Simply add your query in the editor and save it.

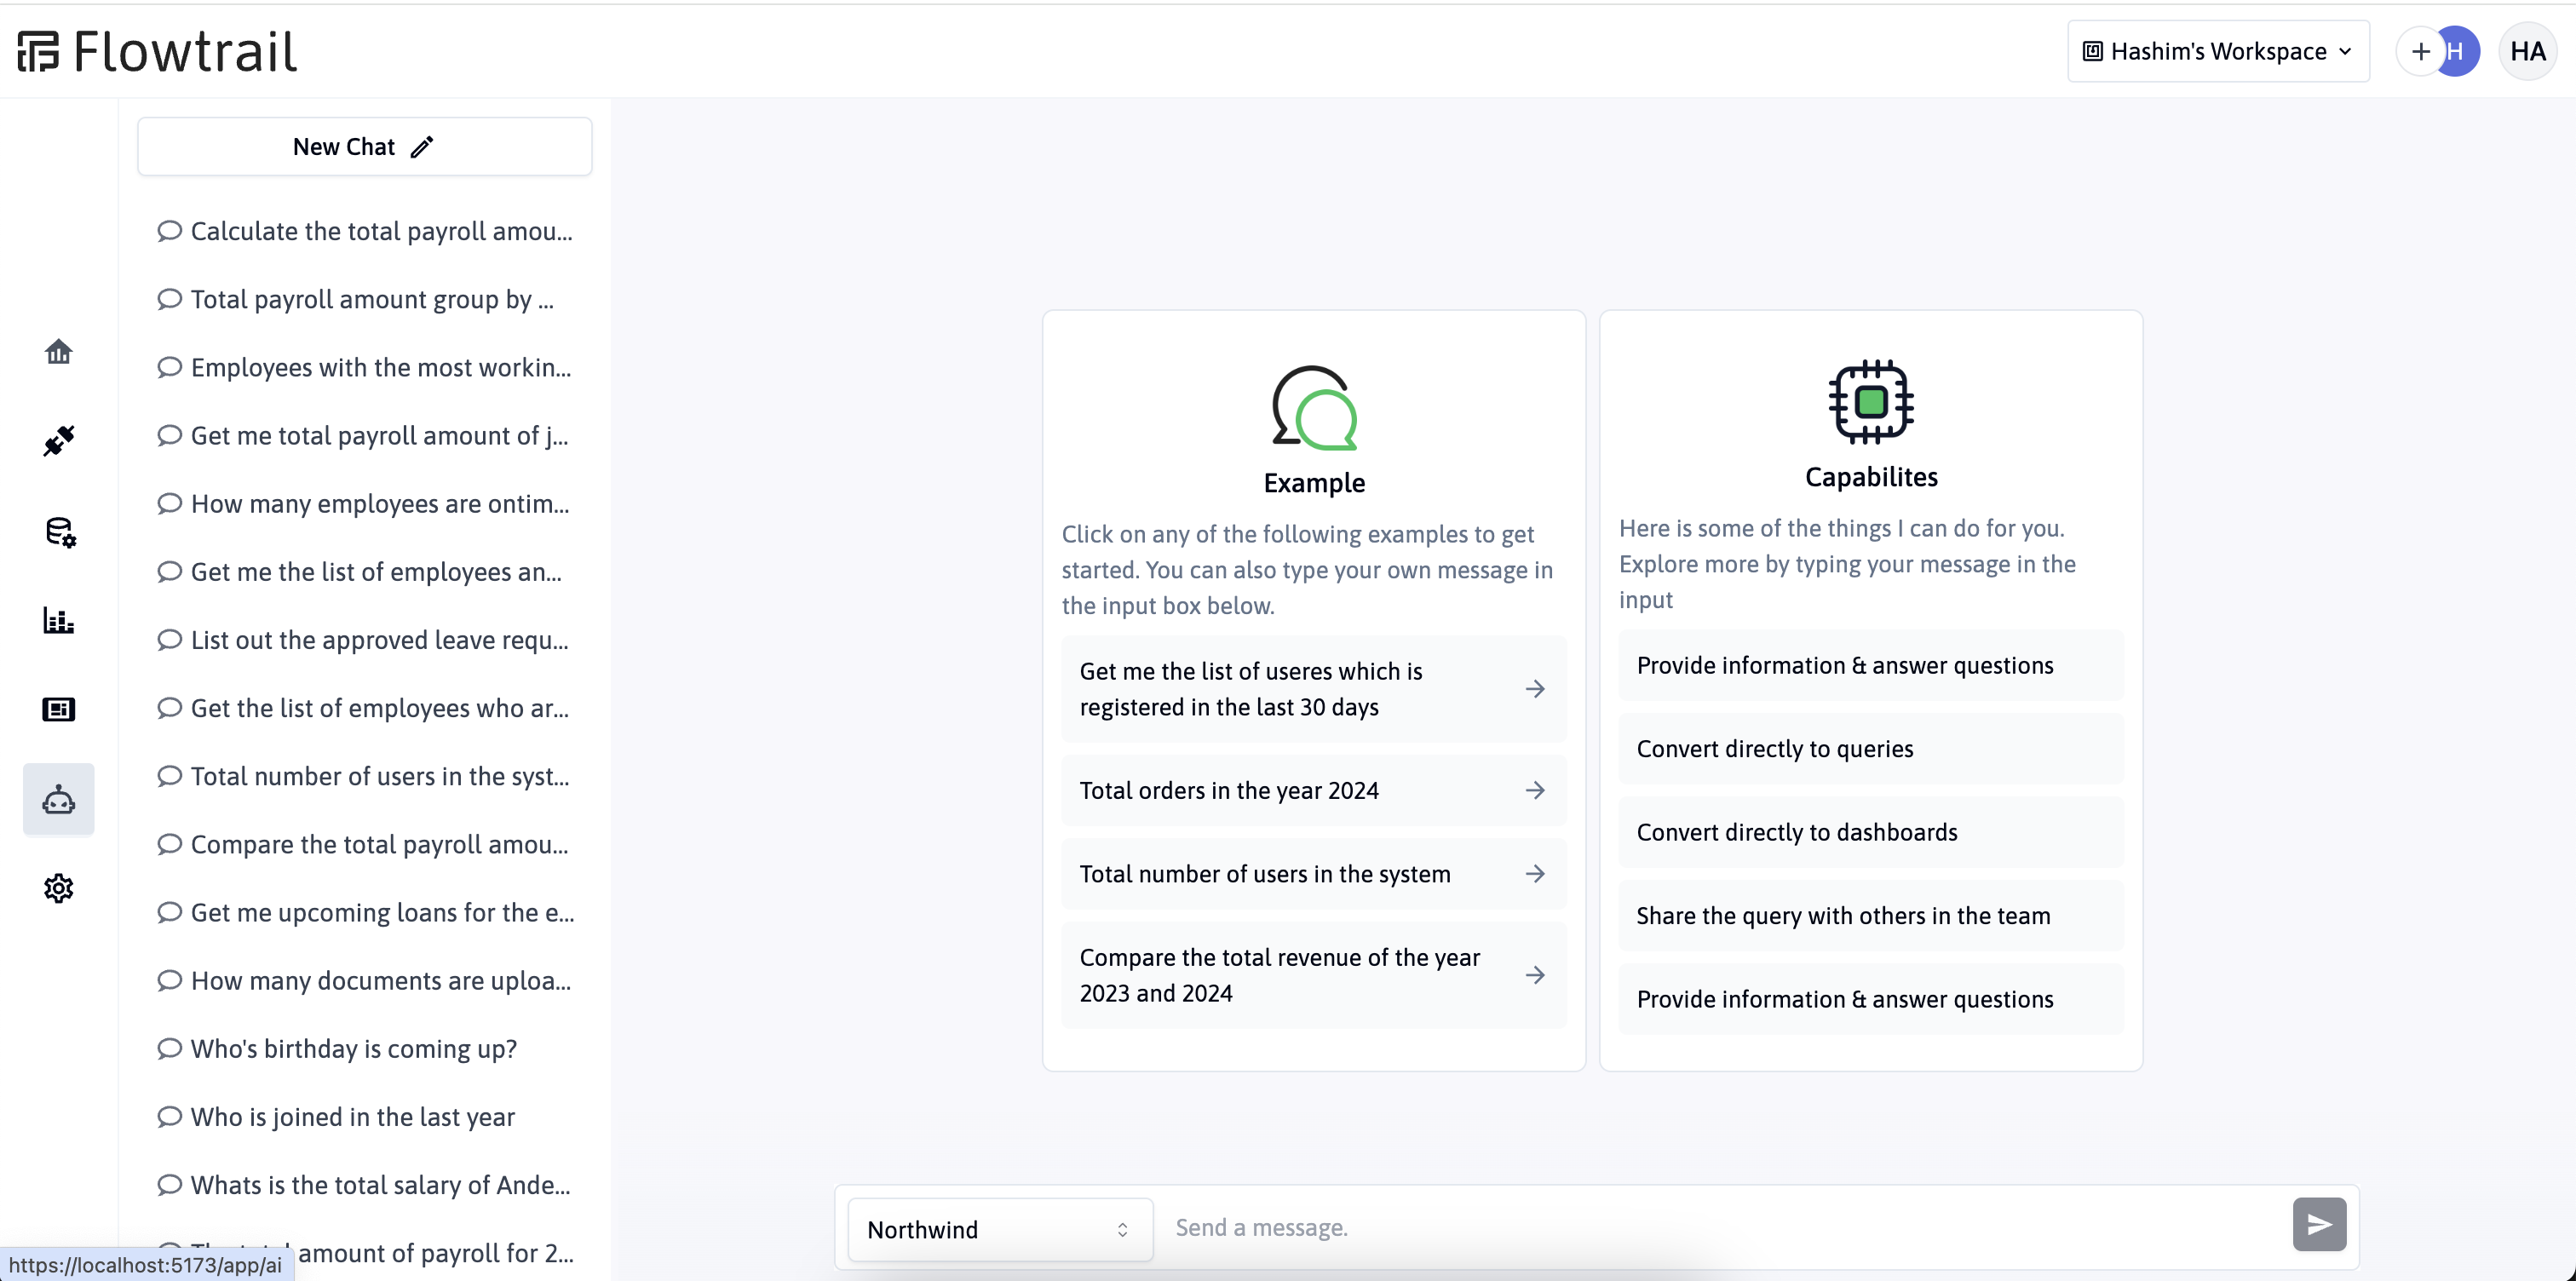
If you’re unfamiliar with SQL, don’t worry, our AI assistant can create it for you. Click on the ‘Ask AI’ button to generate SQL for your database. The assistant will scan your database to understand its structure and generate the appropriate queries for you.

To view your initial dataset, click the execute button below. Remember to save your dataset with a relevant name and description for future reference. Additionally, you can enhance data organization by storing your datasets in particular folders.

Configure report
Let’s visualize your dataset. We offer various visualization types for your dataset. Follow these steps to begin with reporting and visualizations.
- Navigate to the report section from sidebar menu.
- In report editor page, select your dataset and click on Get Data.
- Complete your report by configuring your chart, table, or template reports in the report properties panel.
- Store it with an appropriate name and description in your chosen folder.

By default, Flowtrail AI supports three types of reports: table, chart, and template. You can build the dataset for these reports based on your visualization requirements. Ensure you generate the dataset correctly for each type. For instance, the chart type always needs summary data or some kind of data that can fit the chart axis. Below is a more detailed explanation of these types:
- Table: This report uses a table view to visualize data. To add a column, use the right-side properties. Name your column and select the data field to display in that column.
- Chart: Flowtrail AI provides a variety of customizable charts to effectively visualize your data. Begin by selecting the chart type. Then, identify the field to display on the X-axis, and the field for the Y-axis. You can further personalize the chart by adjusting the background color, border width, and border color as needed.
- Template: These are advanced types of reports where you can design your own custom reports for your data. You can build these reports using HTML and the Nunjucks templating language. The data from the dataset will be fed into the report, allowing you to render it in any way you wish to visualize. If necessary, you can also embed another report within your template reports.

Publish & share report
You’ve now created your report. If you wish to make it accessible to others, you can publish it. Once published, the report will have a public URL that can be shared. Alternatively, you can embed the published report in your application.
- Click on “Publish” button on report page.
- Configure your public reports attributes, like password, export, embed options.
After saving, a unique URL for your published report will be generated. This public URL allows you to conveniently share your insights with others.

Summary
Flowtrail AI is a tool that makes it easy and quick to get important information from your databases. It has a user-friendly interface where you can make your own datasets and visuals. The main advantages are ease of use, quickness, ability to handle lots of data, useful analytics, security, teamwork, and low cost. Creating a report is done by connecting to a database, making a dataset, and setting up the report. You can also share and publish reports with Flowtrail AI. Its AI features can create SQL queries and reports based on what you need.