Introducing Text to Reports - A new way to visualize your data using Flowtrail AI.

Visualizing data is important so that it can communicate patterns and provide insights into trends. In addition to making better decisions, it can help you communicate your findings to your audiences and persuade them. However, creating a data visualization is always challenging. The process requires expertise in a variety of tools and languages.

What is text to reports?
“Text to reports” is a new feature powered by Flowtrail AI that simplifies the process of creating data visualizations. It’s a game changer in the way we retrieve and visualize the information from multiple databases or data sources. By transforming raw text data into structured reports, it provides an easy-to-understand visual representation of complex data. It’s like having your own personal data analyst, translating your text into insightful reports.
In this blog, let’s explore how we can transform your MySQL data into stunning visualizations using natural language with Flowtrail AI.
Transform your text into reports.
With Flowtrail AI, you can simply input your text data and our AI will generate a structured visualization. You can choose from a variety of report formats such as pie charts, bar graphs, or line graphs. The AI also offers the flexibility to customize your report based on your specific needs and preferences. Let’s check how you can do this
Configure your connection.
Establish a connection to your database by entering the details on Flowtrail AI’s data source screen. To add a new connection, follow these steps.
- Log into your account and navigate to the DataSource section from the sidebar.
- Click on Add new connection.
- Select the type of the database you want to connect.
- Next, enter your database credentials. These typically include your database’s hostname or IP address, username, password, and the database name.
- Save the details. Your DataSource is now ready to be used for generating reports and dashboards.
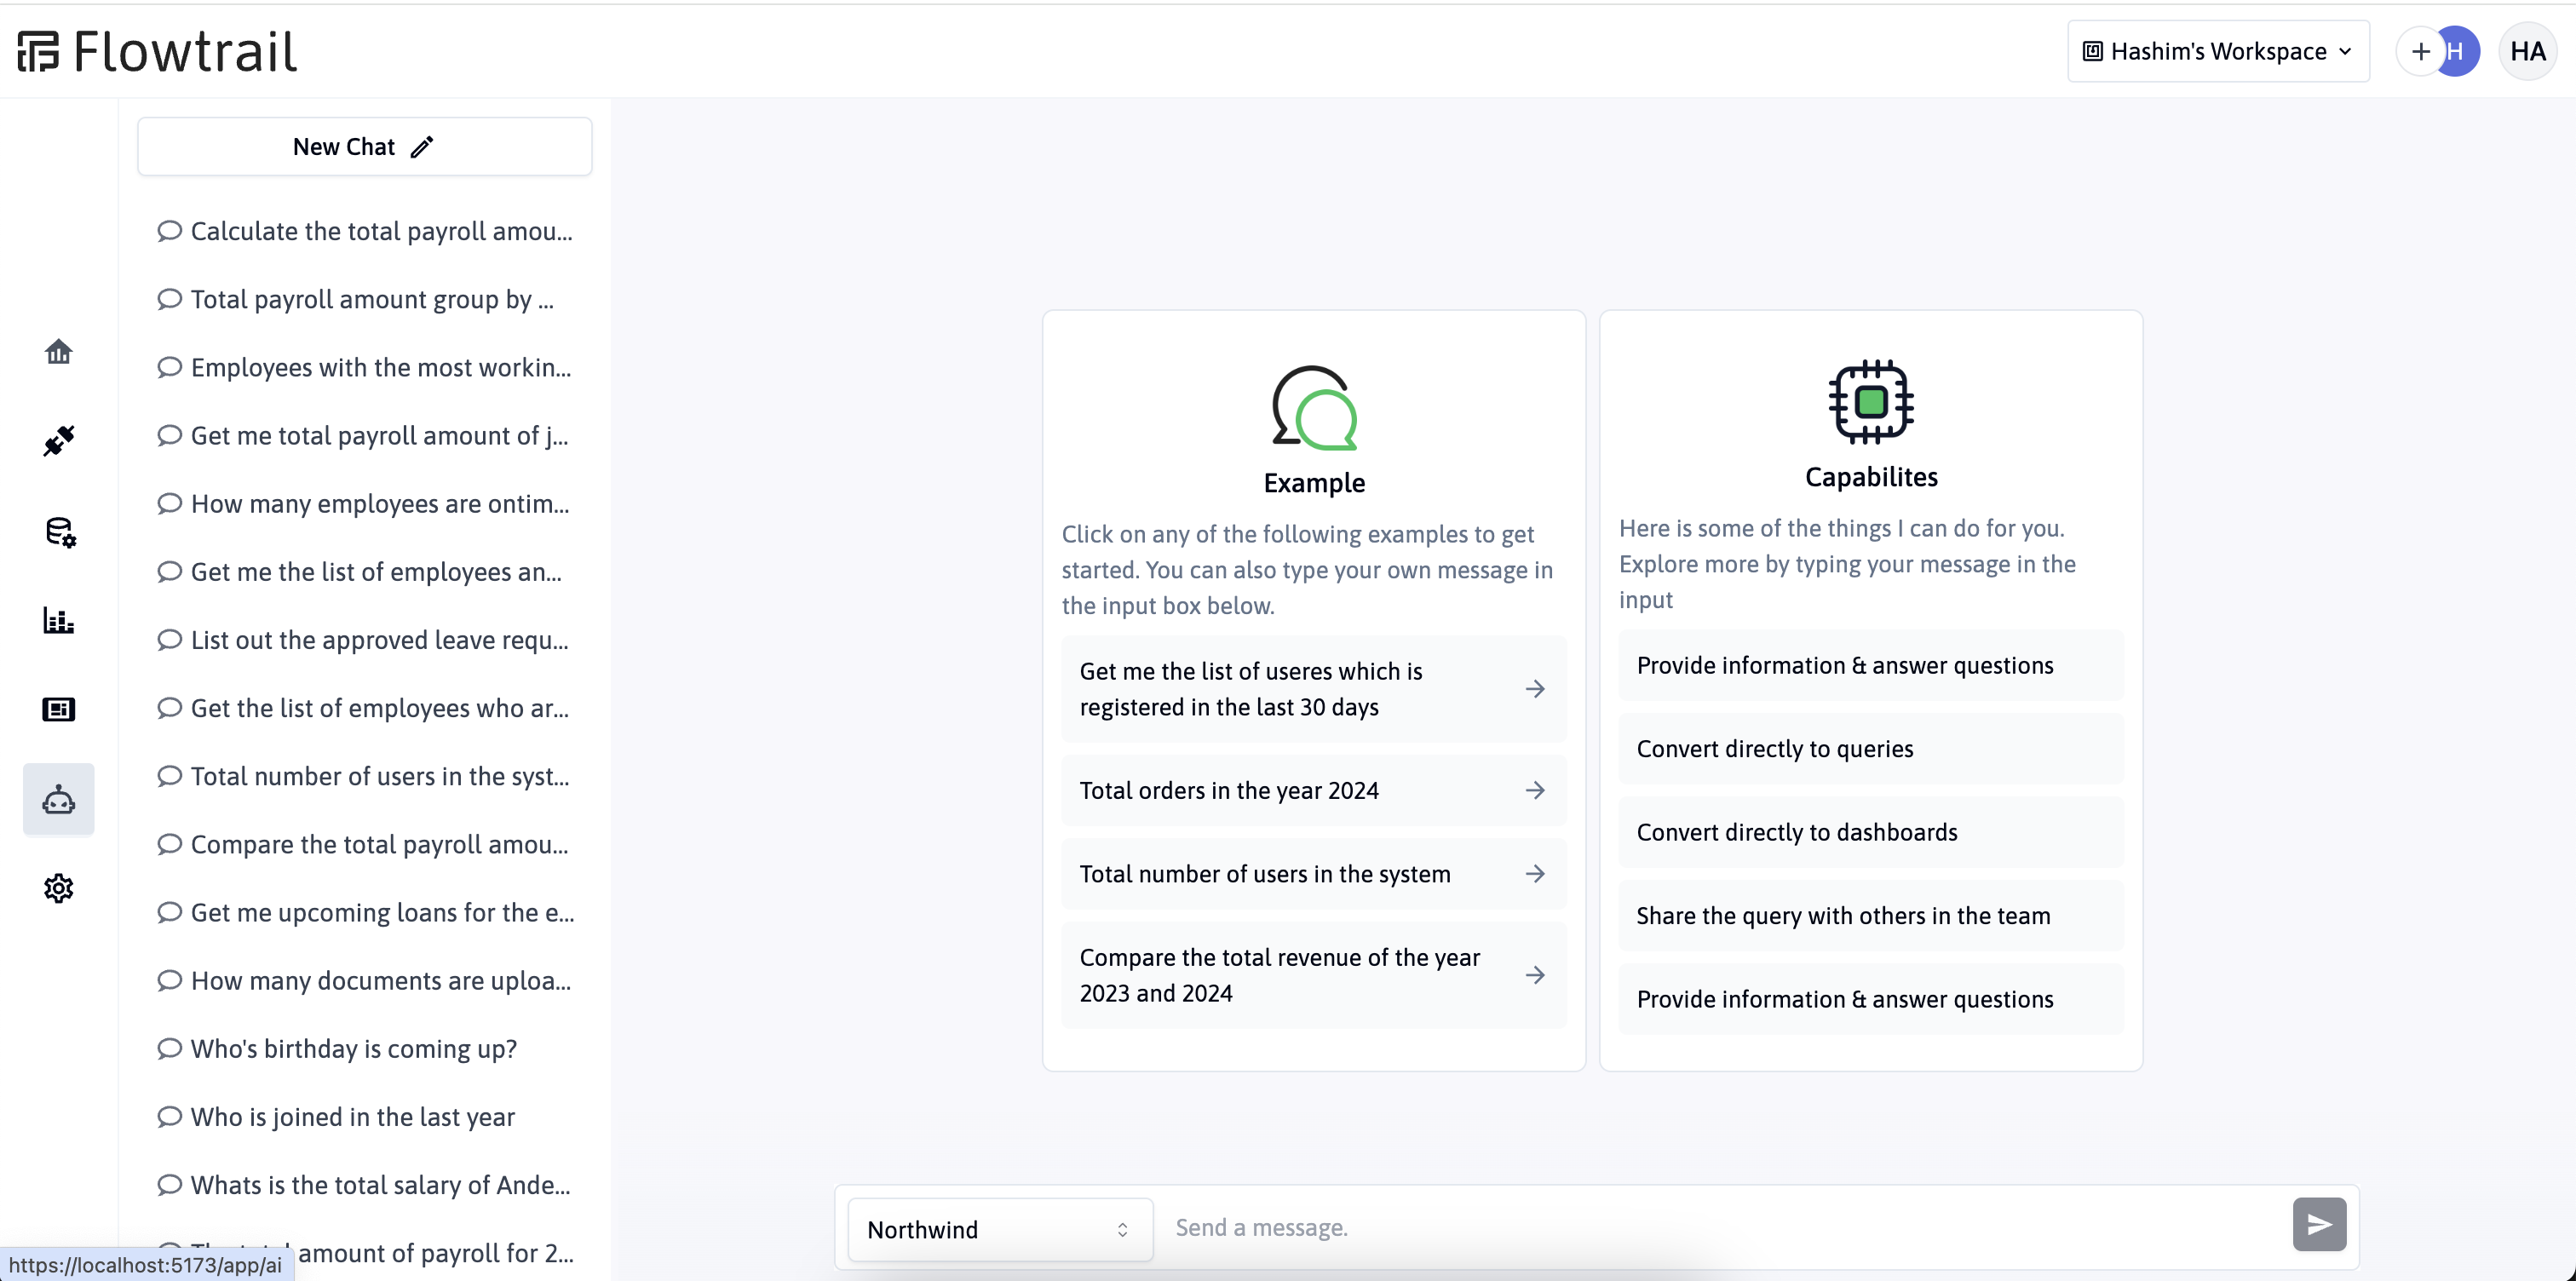
Chat with your DataSource.
Once you’ve set up the connection, you can chat with your data source.
- Navigate to the AI chat screen.
- Select the DataSource you want to chat with.
- Just type in your query or command in a conversational manner, like “Show me the sales data for the last quarter.”
The AI will process your command and present the data in a structured report.
Fine-Tuning Reports and History
Flowtrail AI-generated reports can be fine-tuned as there is history attached to ongoing conversations. This means that all your chat history is meticulously preserved, allowing for a comprehensive record of your interactions. This feature is not merely for record-keeping. The main advantage of this is that you can further instruct the AI to adjust and refine the visualization of your data, and this will be based on the instructions you’ve provided in previous chats.
Our AI chat allows customization of the queries it generates. To do this, go to the query controller and modify the SQL as needed. After clicking ‘execute’, the system will fetch data based on your query, affecting the data accordingly.
Export and publish reports..
You can save each generated report individually by clicking on the save button in the report chat bubble. Each iteration can be saved separately, allowing you to edit them on the reports page and add to the dashboard as needed.
Conclusion.
In the end, our “Text to Reports” feature is changing how users see and use their data. Even if you’re not an expert, this tool makes it easy to show your data in a clear way. Try out the power of Flowtrail AI’s “Text to Reports” by signing up for our private beta. Your thoughts on this feature are very important to us as we work to make it even better. We can’t wait to hear what you think.